How to Convert User Value into Sustainable Revenue
The key challenge is not creating more value but designing pricing, packaging, and product experiences that reduce or appropriately reallocate uncertainty throughout the purchase journey.
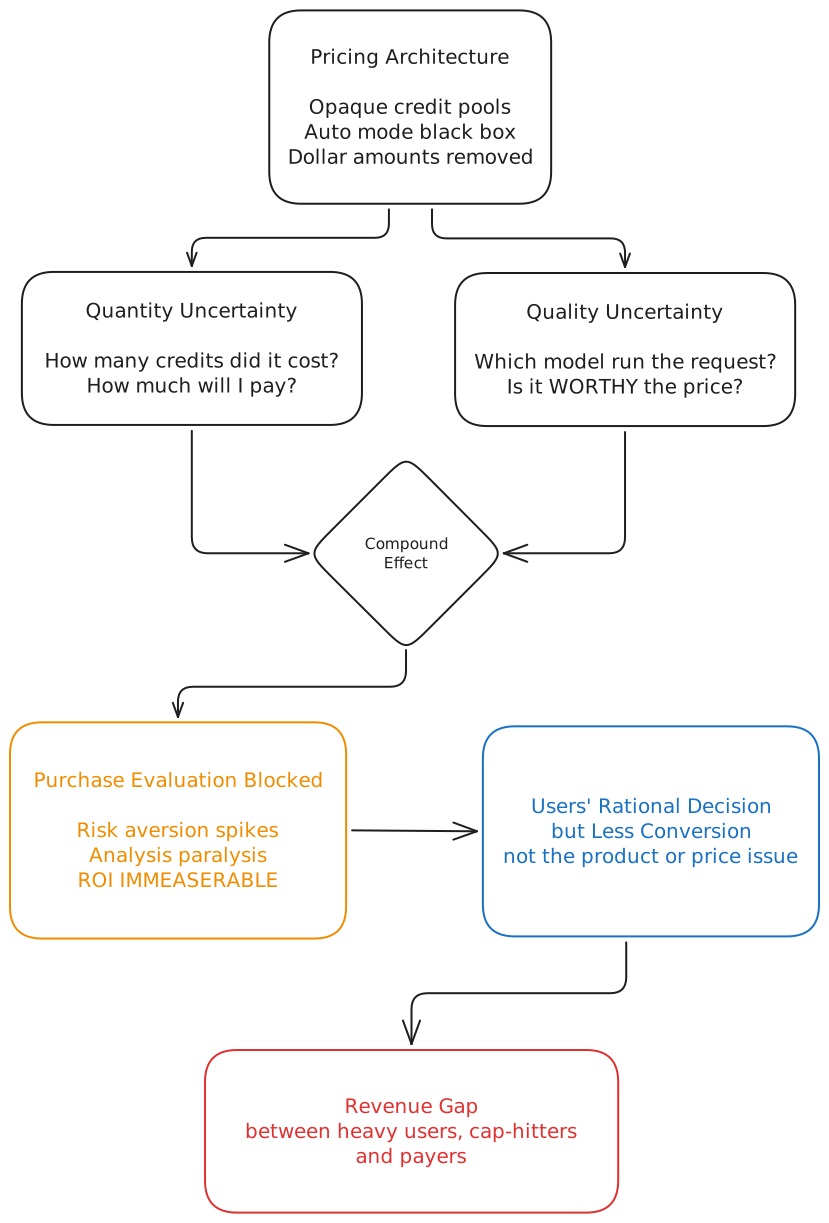
The urge to buy is often driven by multiple factors, yet it faces hurdles the moment uncertainty creeps in. AI products cannot eliminate uncertainty in model output, token consumption, or user workflow. They can only make uncertainty evaluable and assign it to the party best equipped to manage it.
In this case, the uncertainty of cost is the independent variable (IV). Risk Allocation, via pricing model, packaging structure, usage visibility, model selection transparency, is the mechanism. Revenue is the dependent variable (DV).
There are two dimensions in the uncertainty of cost: Quantity and Quality.
I. Objective and Comparators
Cursor is the primary analytical vehicle for this case and it was selected against five criteria:
Demonstrated Value, Uncertainty Intensity (cost uncertainty is a documented binding constraint; the June 2025 pricing change is a natural experiment), Risk-Allocation Designability, Public Evidence, and Segmentability of Users.
GitHub Copilot and Claude Code serve as comparators.
II. Cost Uncertainty Mapping
1.Pricing Architecture

The full comparison of August 2026 pricing, free tier limits, usage visibility, model selection transparency, pricing models, alternative paths, and employer payment across all three products is in the table above. The structural differences that drive the analysis:
Cursor's usage visibility is partially visible but regressing on July 31 2026 when per-request dollar amounts were removed. Individual users lack the Analytics available to Teams/Enterprise. Model selection is a black box.
Copilot's credit consumption is fully transparent with proactive alerts. Model selection is manual (Auto mode exists but is equally opaque)
Claude Code has no Auto routing. Users control model selection. Session timer is visible; weekly cap is not.
2.Two Dimensions of Cost Uncertainty User data reveals that cost uncertainty splitting into two distinct dimensions that amplify each other.


Dimension 1 Quantity Uncertainty: "How much have I used? How much is left? Will I run over?"
Transparency ranges from Copilot (fully transparent) to Cursor (partially visible, recently regressed) to Claude Code (partially transparent).
Dimension 2 Quality Uncertainty: "Which model am I using? How am I being charged?
Is the quality worth this price?" Transparency ranges from Claude Code (fully transparent) to Copilot (manual selection, Auto equally opaque) to Cursor (black box).
III. How Dual Uncertainty Blocks Revenue
1.Natural Experiment: June 2025 Pricing Change
Before June 2025, Cursor Pro was simple: $20/mo = 500 fast requests.
A visible counter showed usage. Users manually selected models. Both Quantity and Quality dimensions were transparent. Users know what they are buying.
After June 2025, Cursor Pro: $20/mo = a credit pool split across two model categories, with Auto mode as the default.
The counter was removed. Auto mode became a black box; users no longer knew which model processed their request or how it was billed. The CEO publicly apologized and offered refunds for unexpected charges.
Sources: cursor.com/blog; Simon Willison's Weblog (2025.07)
2 Limitations of Post-Crisis Fixes
Cursor's response from August 2025 to July 2026 focused on restoring Quantity visibility, but these fixes were unevenly distributed. Teams and Enterprise received full Analytics dashboards and three Auto modes (Cost/Balance/Intelligence). Individual Pro users, which is the largest pool of potential free-to-paid conversions, received the least.
The July 31, 2026 removal of dollar amounts from usage pages was a reversal on the one dimension where progress had been made.
3.Comparator Validation
As the price architecture comparison shows before, Copilot and Claude Code provide counterfactual evidence that the mechanism is real:
Copilot's transparent credit counter is the closest available comparison to Cursor's pre-June 2025 state. Developers using Copilot discuss feature differences, not billing anxiety. The pricing architecture largely reduces the Quantity dimension of uncertainty.
Claude Code's session-based model replaces token-counting with time-bounded capacity. Time is more intuitive than tokens, in which way users have more sense of control and aware that the full capacity awaits after five hours.The 46% "most loved" rating vs. Cursor's 19% cannot be fully attributed to pricing architecture, but the direction is consistent with the Quality uncertainty framework.
4.Conclusion
Cost uncertainty has two dimensions. Solving one does not fix the other. A user who can see their usage (Quantity restored) still cannot evaluate whether their money bought quality or waste (Quality-Cost remains opaque). When both dimensions are blocked, purchase evaluation becomes impossible — and rational non-conversion is the result.
IV. Possible Strategy: Uncertainty Allocation Design Directions
The following directions apply to AI products where cost uncertainty blocks conversion. All in all, it is about make users feel that they have choices among packages understandable, evaluable, and controllable.
Direction 1: Make Quantity Uncertainty Evaluable
Restore dollar amounts. Give Individual users basic Analytics. Fix the free tier IDE-dashboard sync bug.Reference: Copilot, credit counter + alerts + dollar amounts retained.
Direction 2: Make Quality-Cost Uncertainty Evaluable
Tag each Auto mode response with the model used and approximate cost. Make routing visible. Reference: Claude Code, no Auto routing, user controls model selection.
Direction 3: Redefine the Unit of Uncertainty
Supplement credit-based pricing with time-based or task-count options as reference frames and intuitive comparison anchors. Reference, Claude Code and Codex: session window.
Direction 4: Reallocate via Commitment + Escape Hatch
Annual plan (user locks price, company bears risk) + formalized BYOK (power users self-manage cost). Reference, Claude Code: annual plan + API pay-per-token dual path.
Priority: According to the July 2026 regression and user complaint of Cursor, Direction 1 is the experimental target and prerequisite for all other directions.
V. Experiment: Quantity Visibility Restoration
1.The Revenue Gap
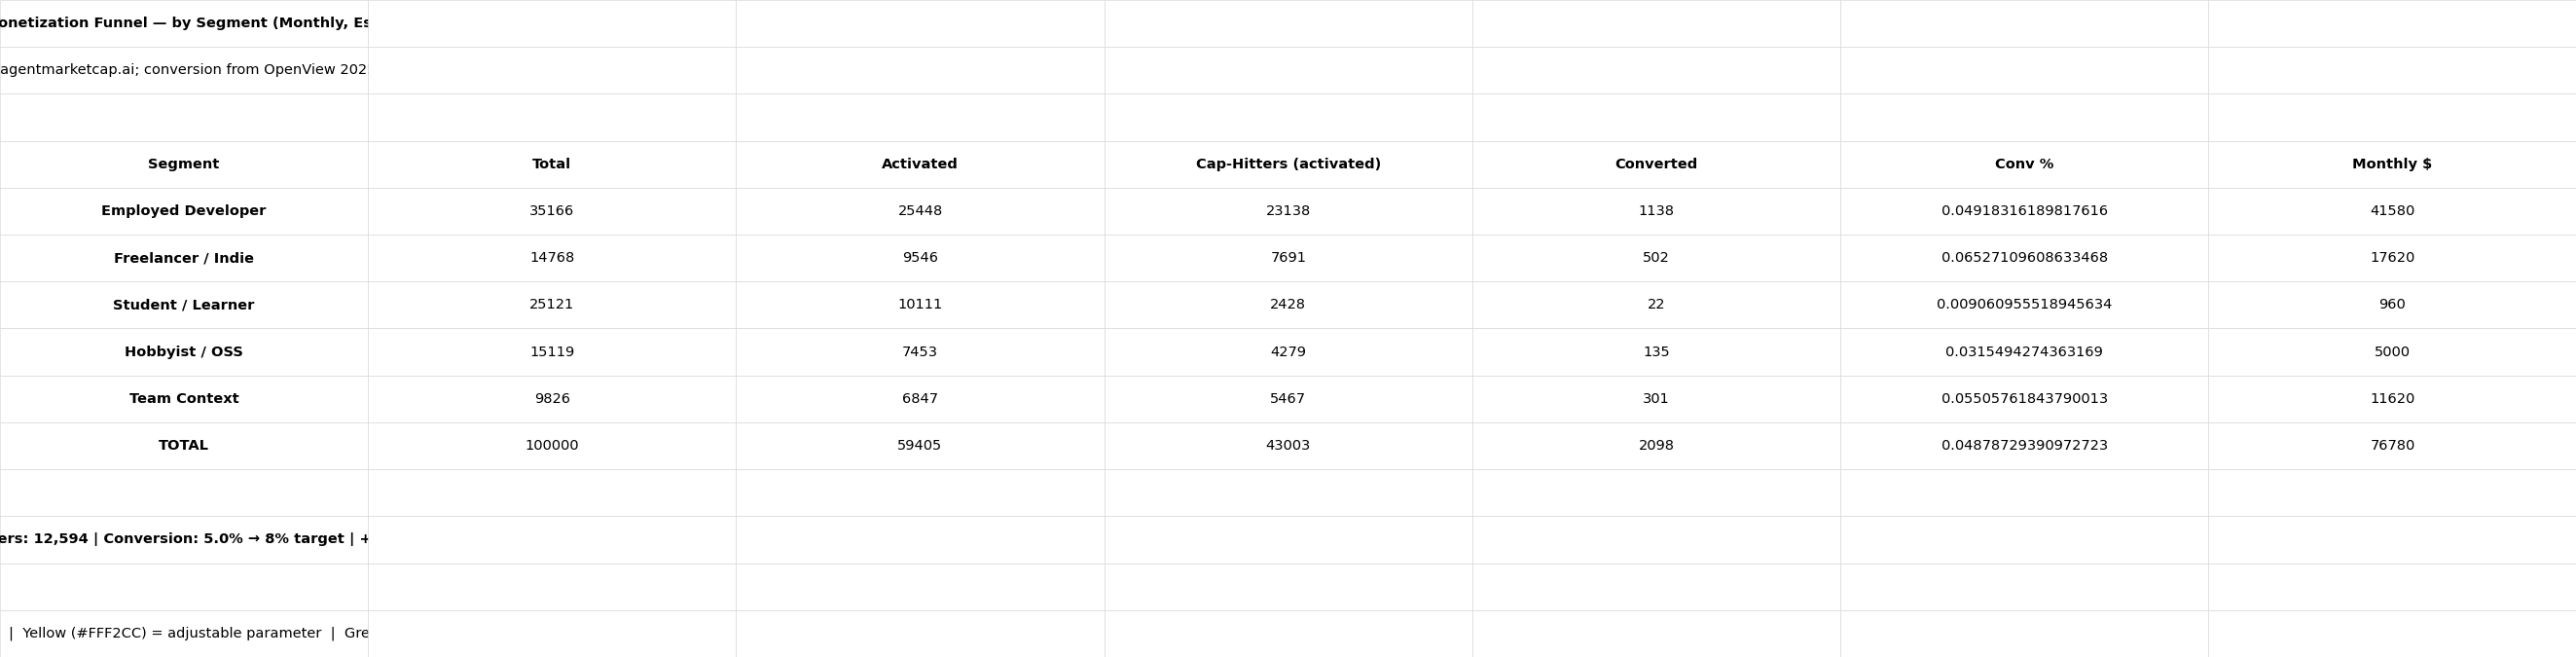
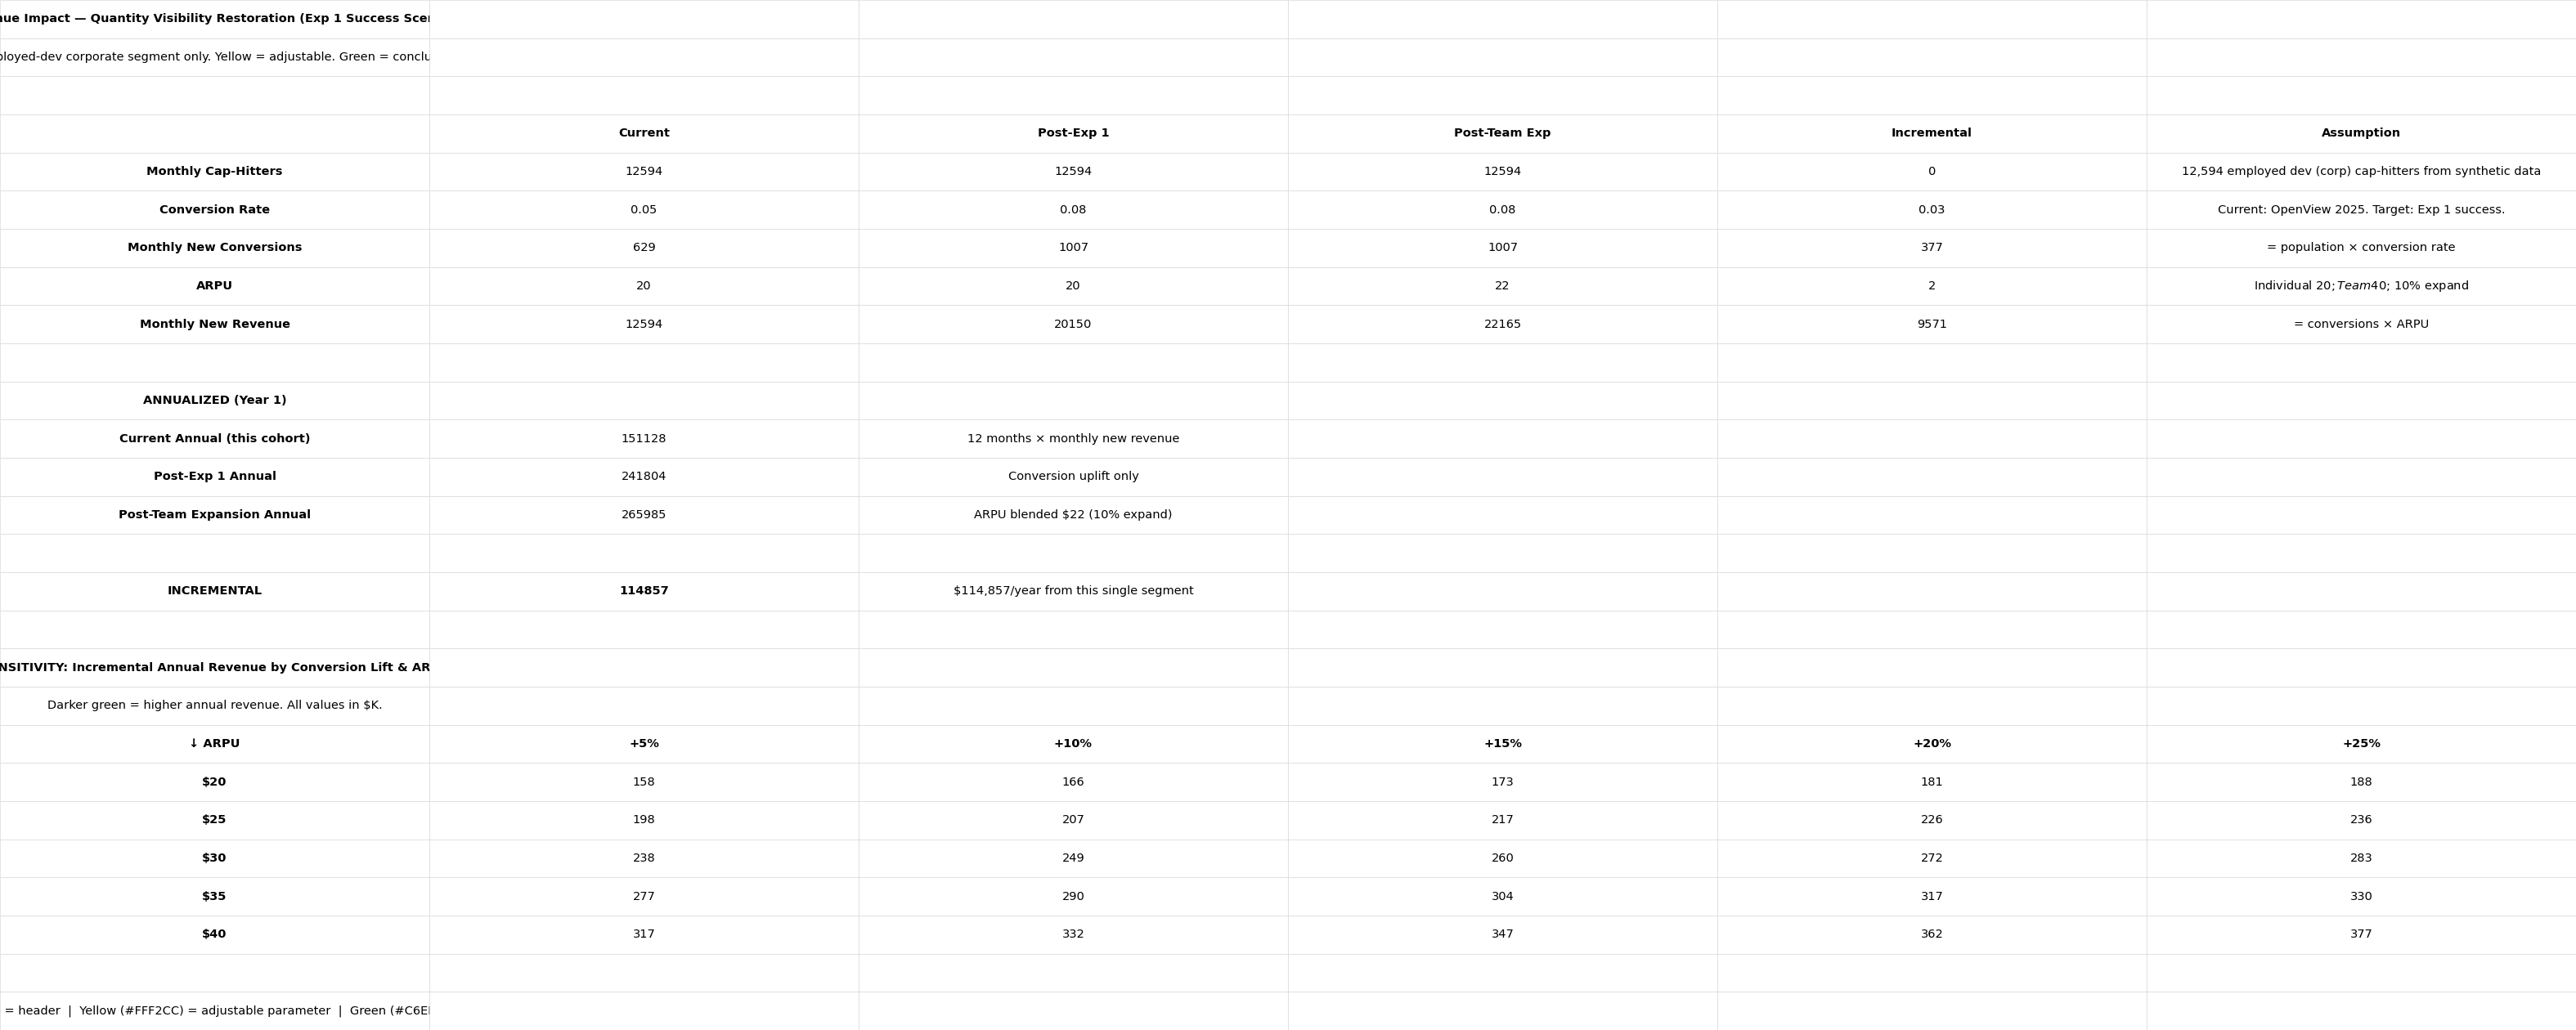
Around 12,600 employed developers on corporate domains hit Cursor's free-tier cap every month and do not pay. At the OpenView 2025 median conversion rate of 5%, they generate ~$12,700 in new monthly revenue. At 8%, which is still below top-quartile PLG benchmarks, that becomes $20,300. The gap: ~$91,000/year from this segment alone, conservative because it excludes freelancers, personal-email devs, and team-context users who also hit caps without converting.
The point is not the precision. The point is that the number is calculable from two observable quantities: cap-hitters and payers, and the space between them is exactly what this experiment measures. Full revenue bridge and sensitivity table are in the workbook below.
2.The Experiment Tests one claim: When cap-hitting users can see what they consume, they become willing to pay for it.
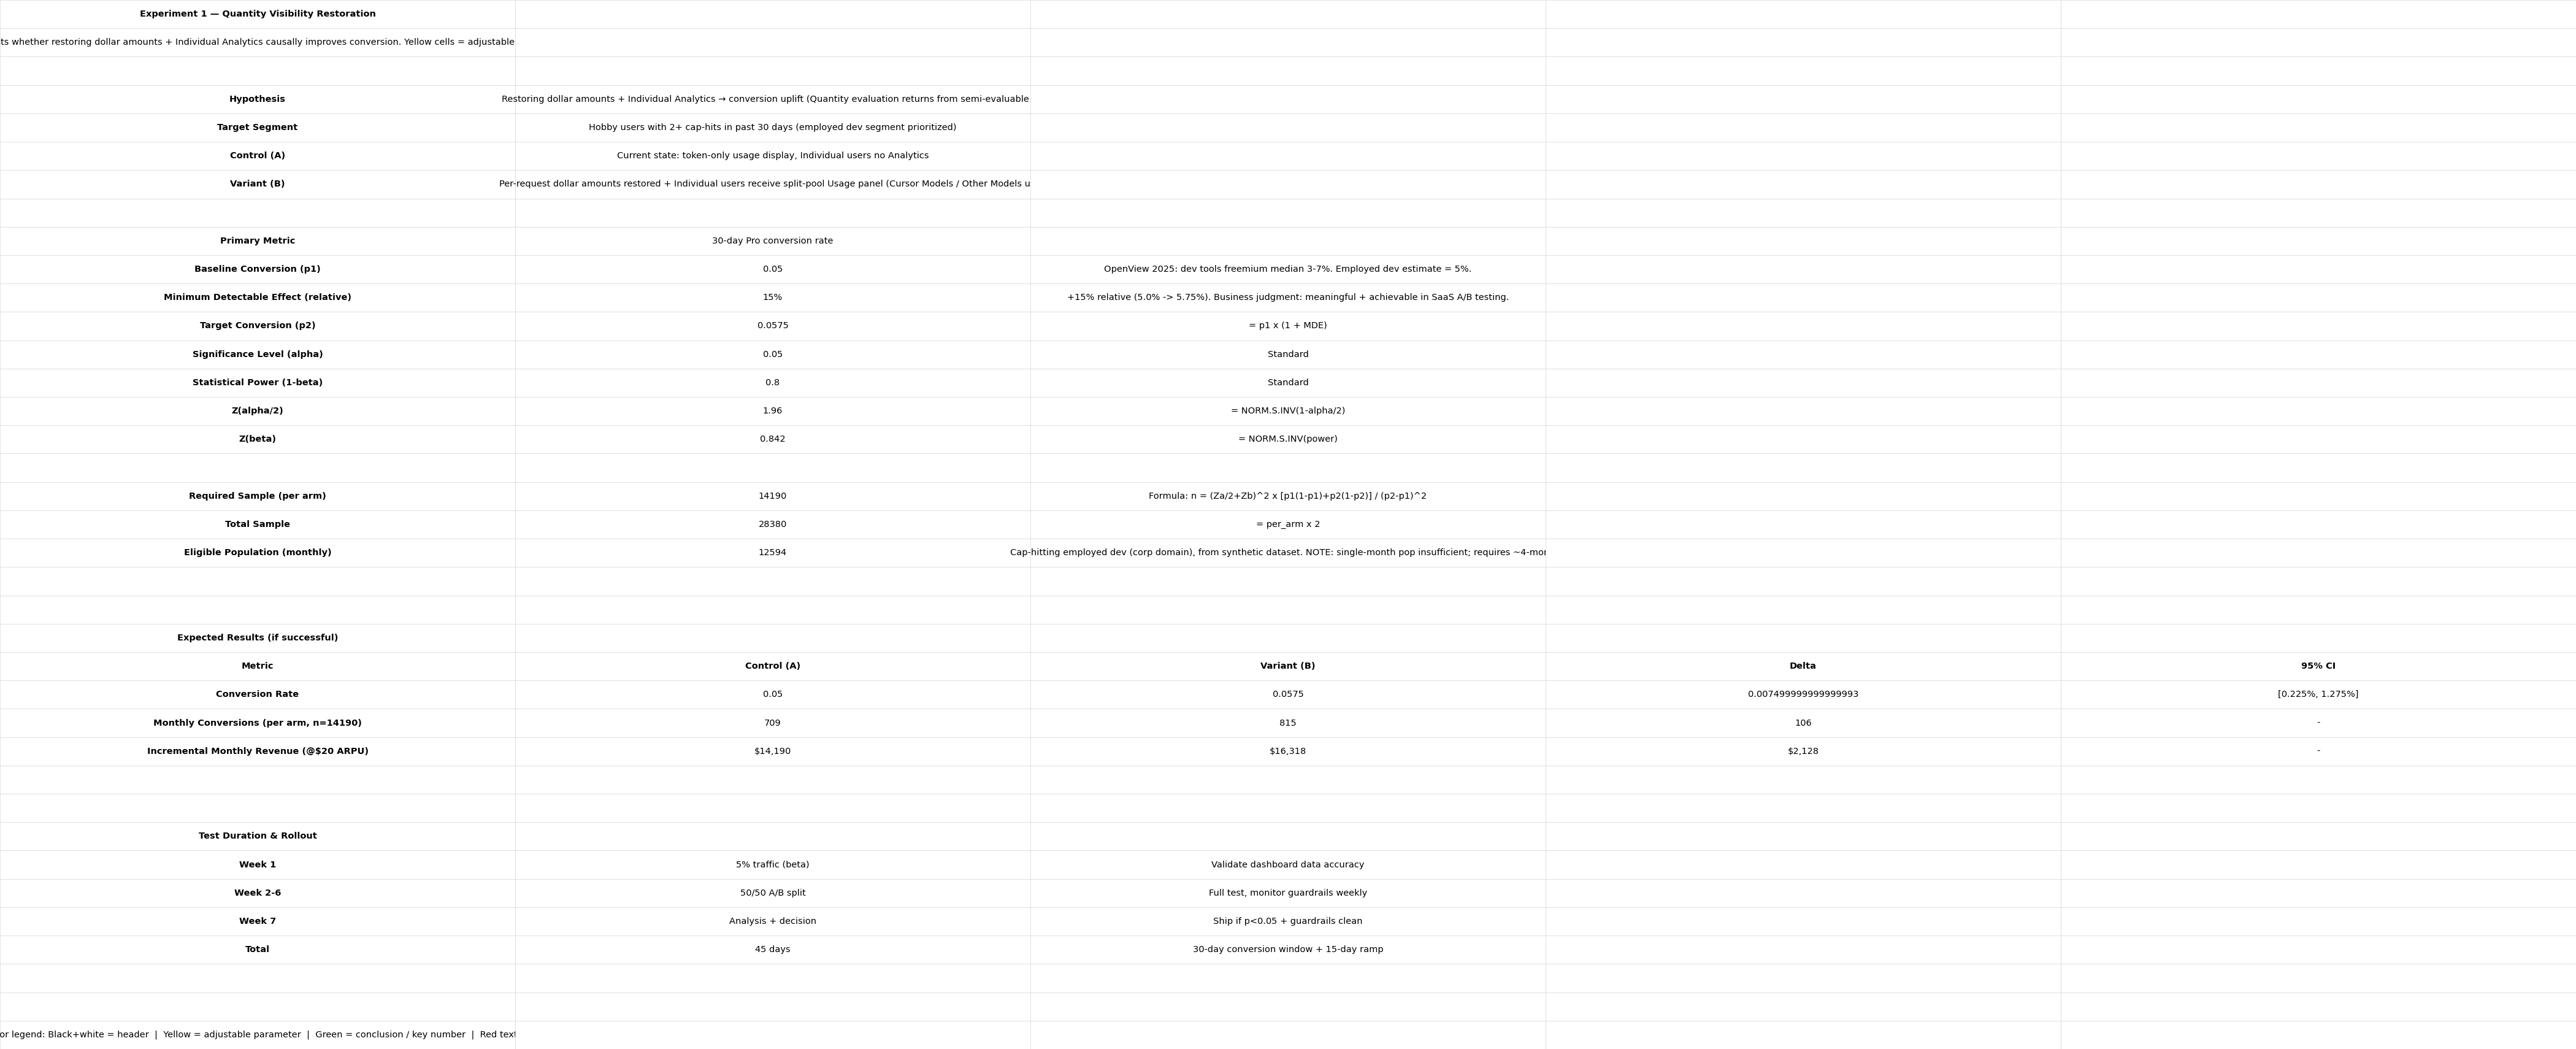
Target: Hobby users with ≥2 cap-hits in 30 days, employed dev segment prioritized.
Control: current token-only display.
Treatment: dollar amounts restored per request, plus a split-pool Usage panel.
Primary metric: 30-day Pro conversion rate.
MDE: +15% relative (5.0% → 5.75%).
Sample: ~48,000/arm (α=0.05, β=0.20).
Duration: 45 days, though the eligible monthly population (~12,600) is smaller than one arm, requiring multi-month accumulation or segment expansion.
3.What the Result Means
A positive result confirms Quantity uncertainty blocks conversion and restoring visibility removes the block. It also serves as a retroactive verdict on the July 2026 decision to remove dollar amounts: if adding them back lifts conversion, removing them was costly.
A null result shifts attention to Direction 2 (Quality-Cost transparency) as the more fundamental lever.
The experiment cannot determine whether $20 is the right price, only whether opacity prevents users from evaluating it. It does not address Quality-Cost opacity, Copilot price anchoring, organizational purchase paths, or long-term retention. Those are separate tests, not failures of this one. The primary guardrail is 90-day churn among new converts, tracked as a secondary metric beyond the test window.
VI. Appendix
1.Data Sources
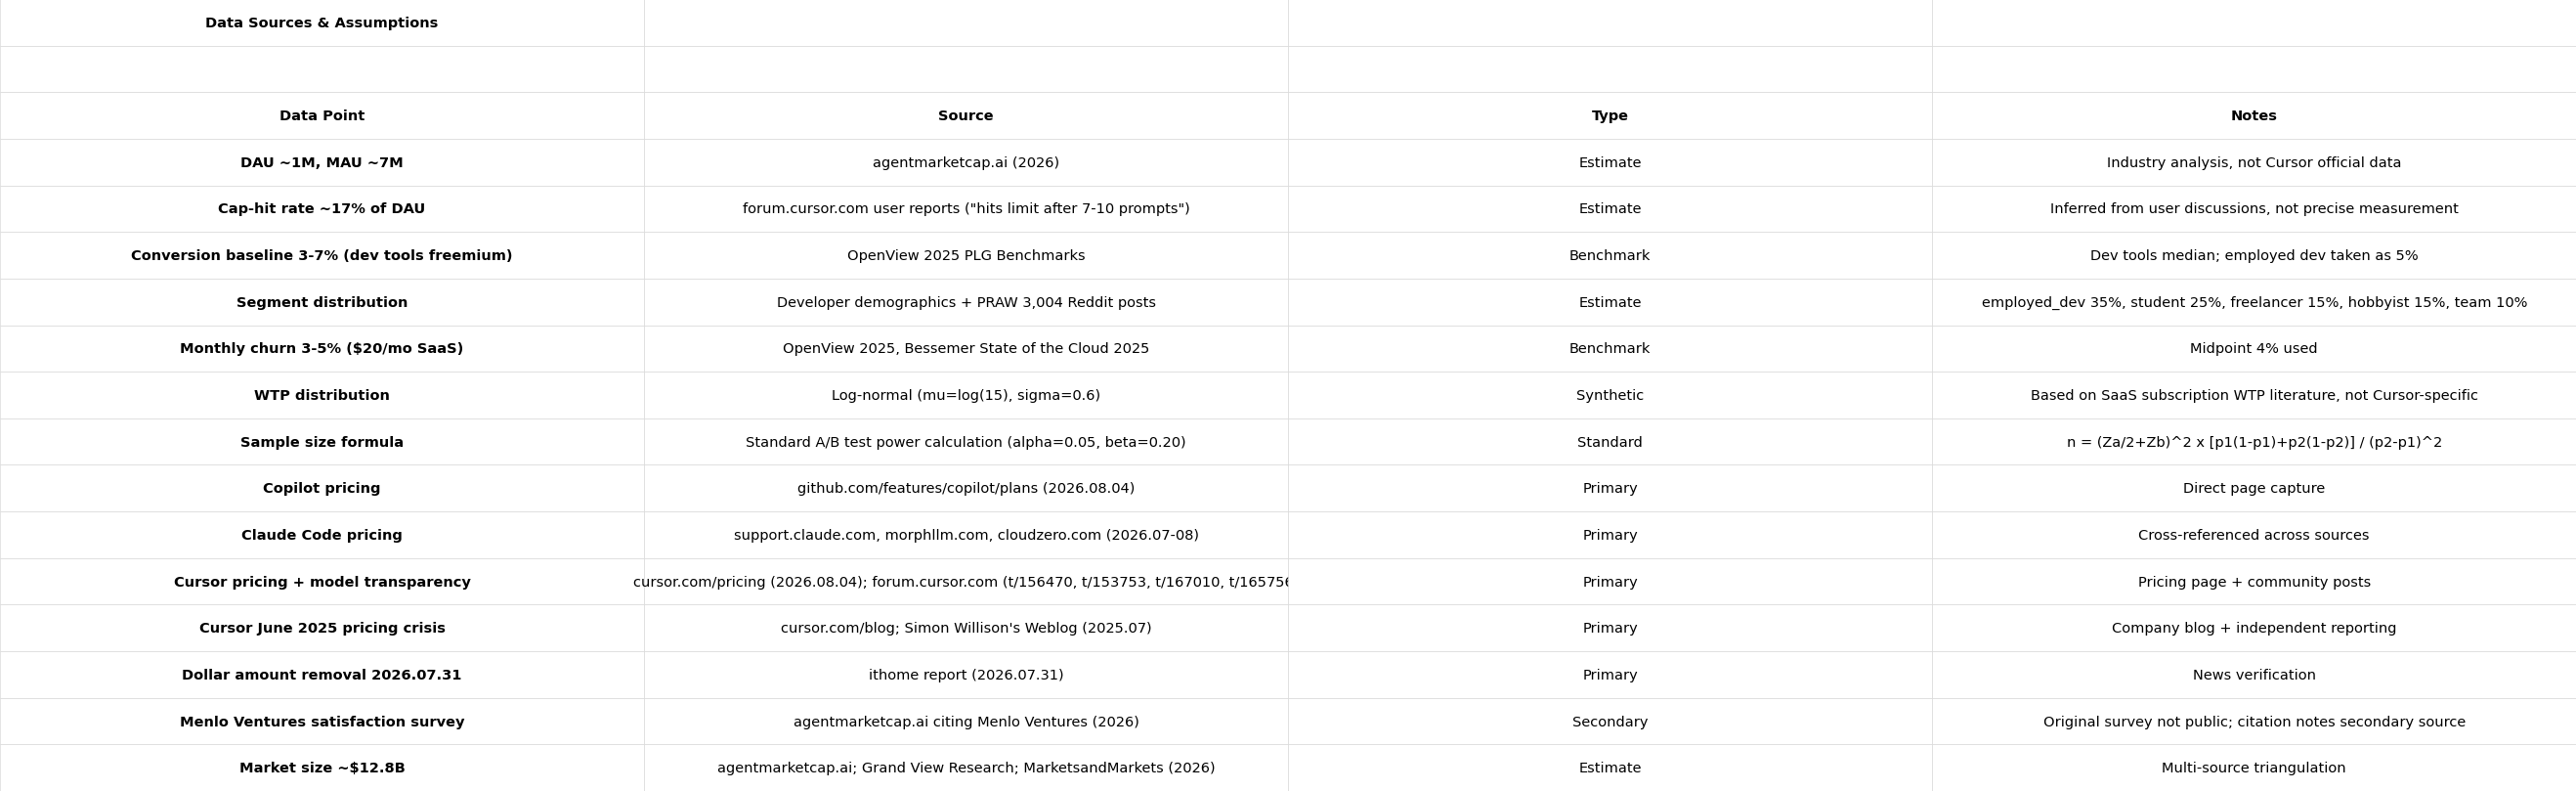 Notes: DAU from agentmarketcap.ai (not Cursor official), conversion baseline from OpenView 2025 benchmarks, cap-hit rate inferred from forum user reports, WTP distribution is synthetic. No internal Cursor data is used.
2.Metrics
Primary:
Cap-Hit-to-Conversion Rate, directly measures uncertainty to payment.
Diagnostics:
Dashboard visit frequency × dwell time: frequent checking without converting signals. Quantity uncertainty is active.
Conversion gap between model selectors vs. Auto users: if manual selectors convert higher, the gap is attributable to Quality-Cost opacity (they made an informed choice, whereas Auto users could not).
Checkout drop-off at pricing info vs. payment form: it distinguishes uncertainty from friction.
Guardrails:
Refund rate: visibility may drive conversion, but if actual cost burns faster than the dashboard projected, refunds spike.
90-day churn of experiment converts vs. organic converts: if higher, visibility pulled in users who were ready to try but not ready to stay, likely because Quality-Cost opacity remains.
Free-tier DAU showing dollar estimates to non-payers must not scare away users who would otherwise remain engaged and convert later.
3.Data Gaps
Seven gaps with impact assessment and mitigation in table below: Cursor internal funnel, segment-level conversion/retention, WTP, Auto mode usage rate, Copilot/Claude Code internal funnels, ARR/DAU precision.

Core principle: public data supports directional analysis but cannot provide precise baselines. All numbers are labeled as estimate, benchmark, or synthetic. Comparators are used for structural contrast, not numerical benchmarking.